Power Consumption Testing
Intro
The energy consumption of apu platforms is a topic worth paying attention to. Power consumption is valuable with continuous software improvement. Thanks to this information, it takes less time to detect errors.
Setup testing environment
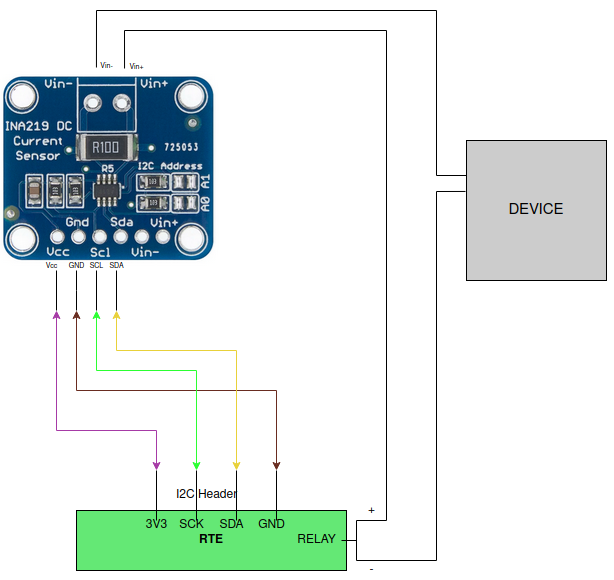
Measuring power consumption is possible due to the connection of RTE with the INA219 sensor. RTE (Remote Testing Environment) is the device which might support debugging and testing the devices, of course it might be replaced by another device with an I2C header. The INA219 is a current shunt and power monitor.
Connecting the RTE I2C header (J9) with the INA219 I2C header allows reading information from the sensor:
| RTE I2C header (J9) | INA219 I2C header |
|---|---|
| 1 (3V3) | (Vcc) |
| 2 (SCK) | (SCL) |
| 3 (SDA) | (SDA) |
| 4 (GND) | (GND) |
The next step is to connect the appropriate wires to Vin- and Vin+. It is required to cut one of the wires in the power cable running from RTE to the device. The connection is made by cutting off the plus and connecting the cable so that the part coming from RTE is connected to Vin +, and the part coming out of the device to Vin-.
The values from the sensor in the tests are normally read every 0.5s, but it is a modifiable value. It is possible to read information about voltage(V), current(A) and power(W) from the sensor. The following commands are used to read the values from the sensor:
cat /sys/class/hwmon/hwmon0/in1_input
cat /sys/class/hwmon/hwmon0/curr1_input
cat /sys/class/hwmon/hwmon0/power1_input
Tests
Apu stress-test CPU
A test case is following:
- Power on RTE and power on apu3.
- Boot to Debian 10 (buster) with kernel 4.19 on apu3.
- Start measurements on RTE: constantly measure bus voltage, current and input power in 0.5 seconds time intervals and save them to a text file.
- After 10 seconds from starting measurements, invoke
sysbenchcommand on apu3. - When
sysbenchis finished, wait ~25 seconds and invoke the command again. - When
sysbenchcommand was invoked 10 times, finish the entire test.
Presentation of the results
The test results are presented as charts based on the values obtained during the tests. Graphs or simple information on power consumption are available in the PC-ENGINES newsletter.
Plans for tests
Measurement plans in case of test development:
- at the start of the device
- during the memtest
- when the platform is constantly restarted